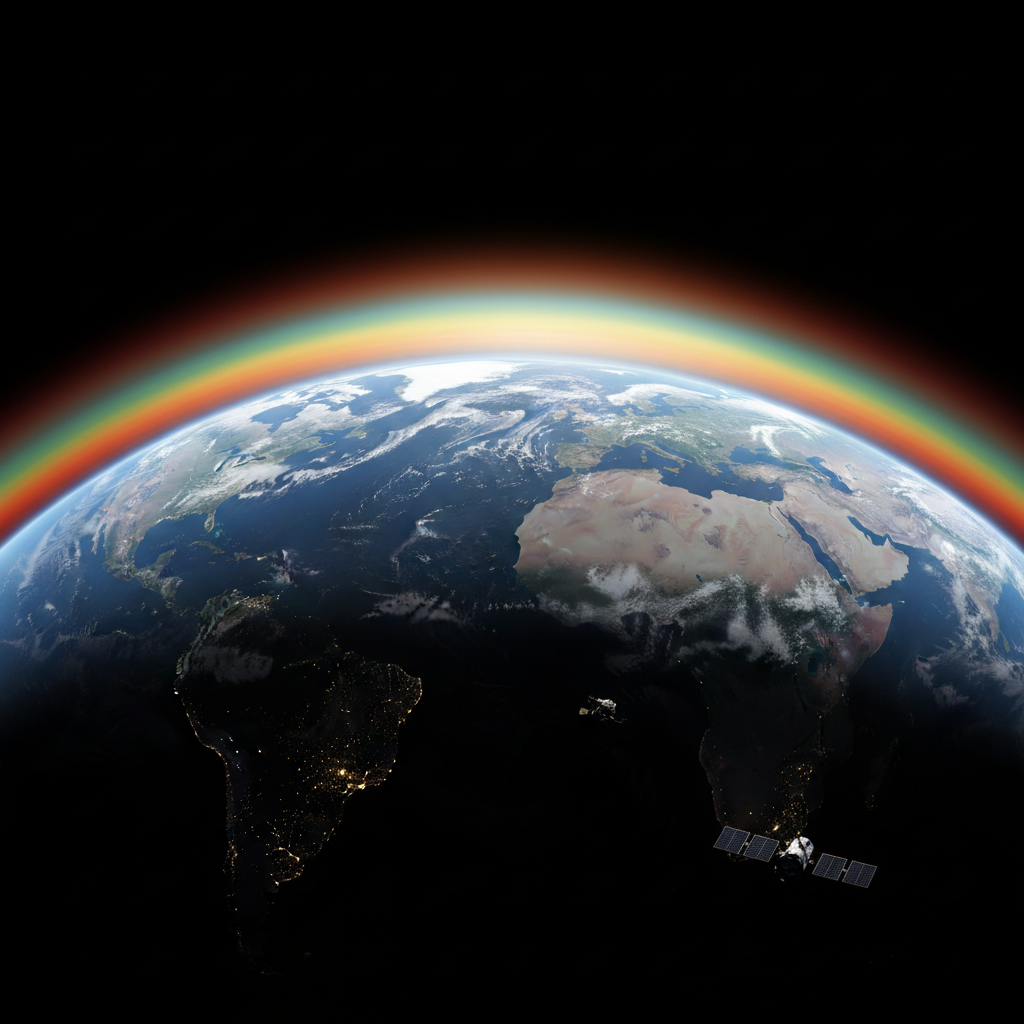
Every fifteen minutes, every ten meters, every decision.
The numbers that
define the signal.
Each specification is a constraint on what analysis is possible. These are ours — and why they matter to the decisions you make.
Three industries.
One intelligence layer.

Fleet movements from fluorescent-lit SCIFs.
Defense analysts track vessel behavior patterns across contested waters without filing a single FOIA request. Orbit's AIS-correlated optical layer flags dark vessels — ships that disable transponders — by comparing expected positions against observed wakes and shadows. Our imagery is cleared for SCIF distribution under ITAR-compliant data handling agreements.
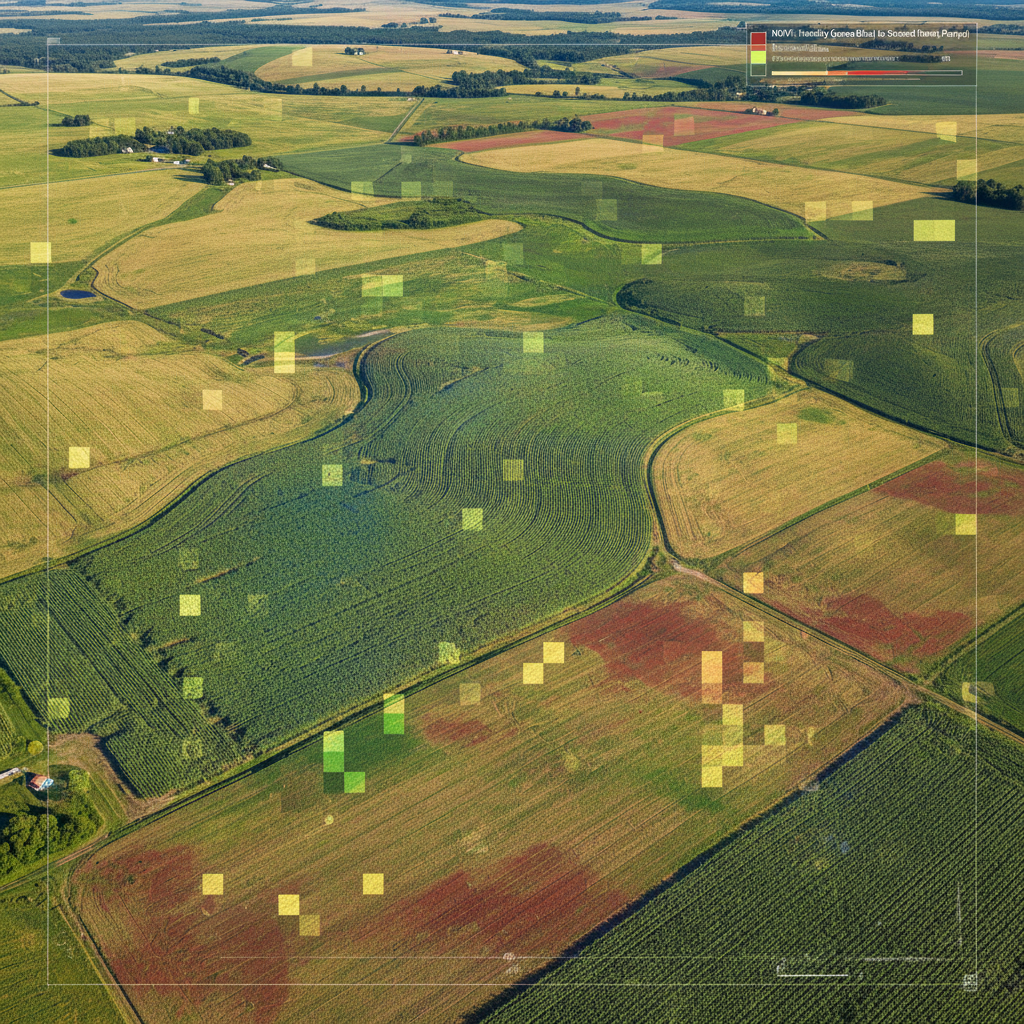
Hedge futures against drought patterns before the market moves.
Agricultural conglomerates receive field-level NDVI, NDWI, and SAVI indices updated every fifteen minutes during growing season. A drought stress event in the São Francisco Valley appears in your risk model 6 hours before it surfaces in weather station data. Commodity traders at firms like Archer-Daniels-Midland use our crop stress index to position futures positions ahead of harvest yield revisions.
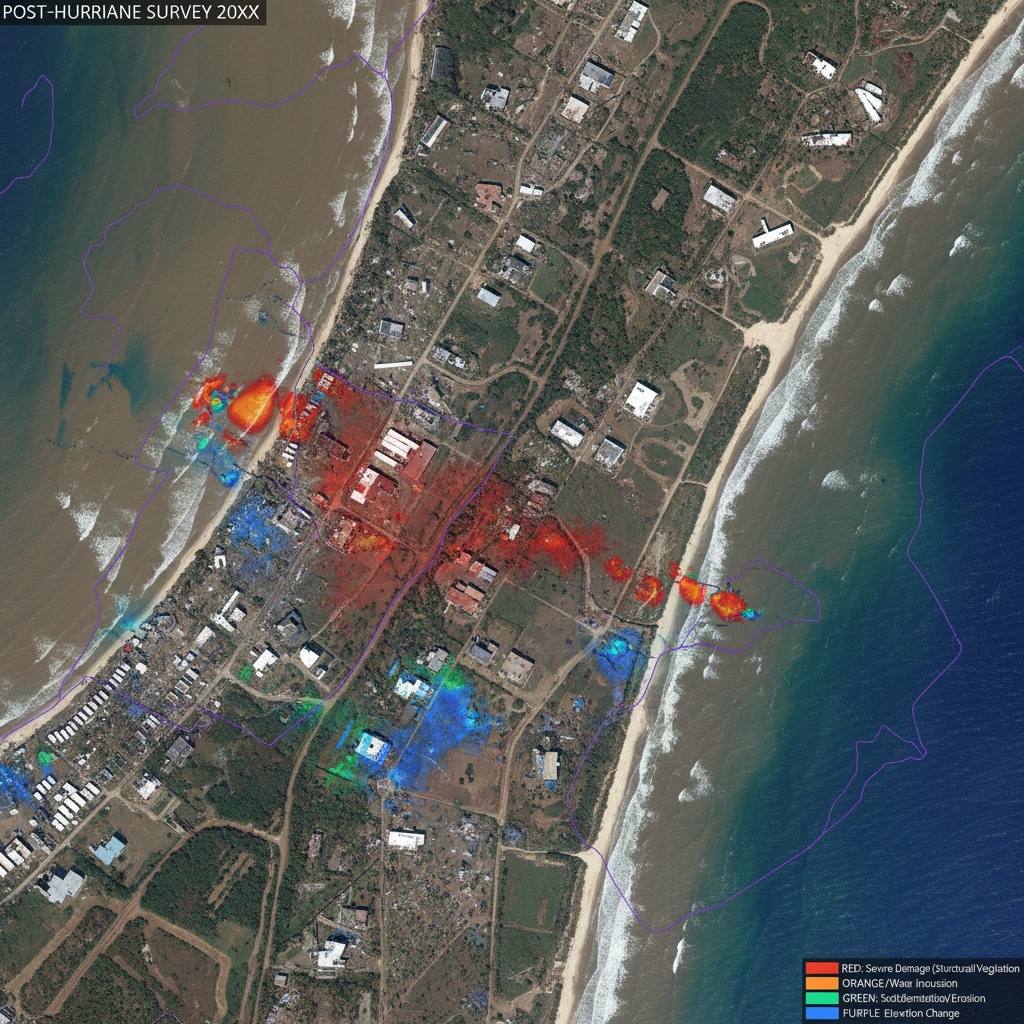
Reprice coastal portfolios after every hurricane season.
Insurance underwriters at carriers like Zurich and AXA XL use Orbit's post-event damage assessment to update property exposure models within 48 hours of landfall — before adjusters reach the field. Our spectral change detection distinguishes structural damage from debris scatter, enabling automated claims triage and reinsurance treaty negotiations grounded in satellite-verified loss estimates.
Read the whitepaper.
Or read this page.
Every specification is documented, every claim is reproducible. The bands below are not marketing — they are the physics of what we can detect.
The demo is not a toy.
It's the actual data.
The sandbox runs against our live constellation feed. You'll manipulate real spectral imagery, real alert streams, real API responses — not a staged mockup. If the demo doesn't convince you, the product won't either.