LIVE FEED — ORBIT PLATFORM v4.2.1
ORBIT COMMAND — GLOBAL OVERVIEW — 2026-02-27 23:38 UTC
● ACQUIRING PASSSAT-7 / 14:23 ETA
ACTIVE ALERTS — 7
WILDFIRE — CALIFORNIA
Perimeter +2.4km
DROUGHT INDEX — BRAZIL
NDVI -0.18 anomaly
VESSEL CLUSTER — SCS
47 assets tracked
FLOOD EXTENT — BD
Area +340km²
METHANE PLUME — TX
Band 12 anomaly
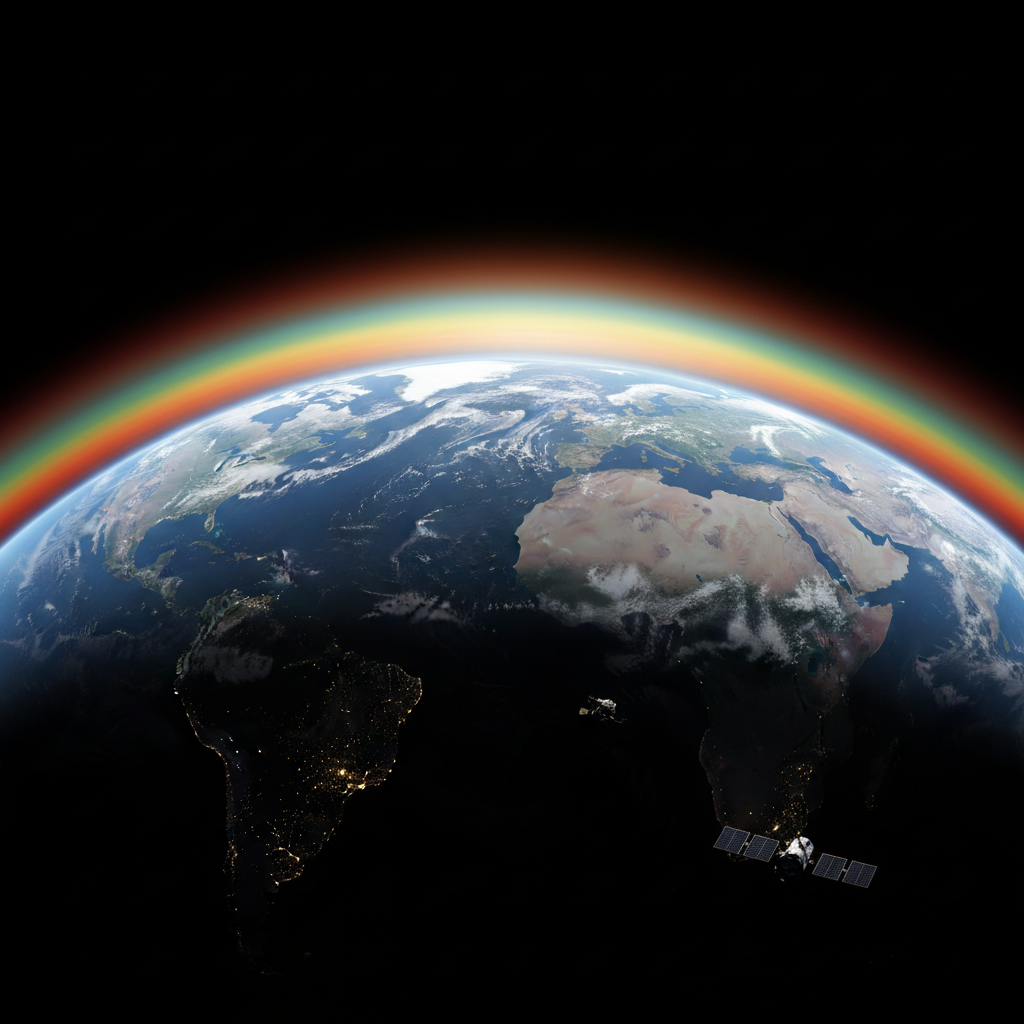
Global satellite basemap showing Earth from orbit with atmospheric layers visible
14:23:07UTC
PASS 7/12TODAY
10.2mGSD
NDVI TIMESERIES
CURRENT0.72NDVI
ANOMALY-0.18DELTA
TREND↓ 7D
CONSTELLATION: 47 SATSCOVERAGE: 94.2%LATENCY: 847ms
ALL SYSTEMS NOMINAL

Every fifteen minutes, every ten meters, every decision.

SCROLL TO SPECS
TECHNICAL SPECIFICATION

The numbers that
define the signal.

Each specification is a constraint on what analysis is possible. These are ours — and why they matter to the decisions you make.

01
TEMPORAL RESOLUTION
0MIN

Revisit Frequency

A wildfire perimeter that grew 2.4 kilometers in the time it took to read this sentence — our next pass was already scheduled. Emergency managers receive updated containment boundaries before ground crews can reposition. No other commercial constellation matches sub-quarter-hour revisit at global scale.

02
SPATIAL RESOLUTION
0M

Ground Sampling Distance

At ten-meter resolution, a shipping container is four pixels wide. An agricultural field shows row-by-row stress variation. A coastal infrastructure survey resolves individual buildings in flood-affected zones. Resolution determines what decisions are even possible — ours makes the marginal call.

03
MULTISPECTRAL DEPTH
0

Spectral Bands

Band 12 detects methane absorption at 2.2μm — a wavelength invisible to the human eye and most satellites. Energy companies use this to identify pipeline leaks before they become reportable incidents. Insurance underwriters use band 8A to separate healthy from stressed vegetation in drought-risk portfolios.

04
END-TO-END PIPELINE
0MS

API Response Latency

From satellite downlink to API response: 847 milliseconds median latency. Our ground station network spans 14 facilities across 6 continents, ensuring no orbital pass waits more than 4 minutes for a downlink window. Your application receives processed, orthorectified imagery before your next database query completes.

05
TEMPORAL DEPTH
0YR

Historical Archive

Seven years of calibrated, cross-sensor-normalized imagery — a commodity futures trader can reconstruct drought patterns across three growing seasons. An insurance actuary can re-run coastal exposure models against historical hurricane tracks with the same 10-meter fidelity as today's live feed.

CLIENT VERTICALS

Three industries.
One intelligence layer.

Satellite view of Earth showing ocean with vessel tracking overlays and orbital data streams
Dark vessel detections2,847last 30d
Fleet tracking accuracy99.1%
ITAR clearanceLevelIII
DEFENSE & INTELLIGENCE

Fleet movements from fluorescent-lit SCIFs.

Defense analysts track vessel behavior patterns across contested waters without filing a single FOIA request. Orbit's AIS-correlated optical layer flags dark vessels — ships that disable transponders — by comparing expected positions against observed wakes and shadows. Our imagery is cleared for SCIF distribution under ITAR-compliant data handling agreements.
Automated anomaly detection with configurable alert thresholds
Direct API integration with existing risk management platforms
Custom spectral band combinations per use case
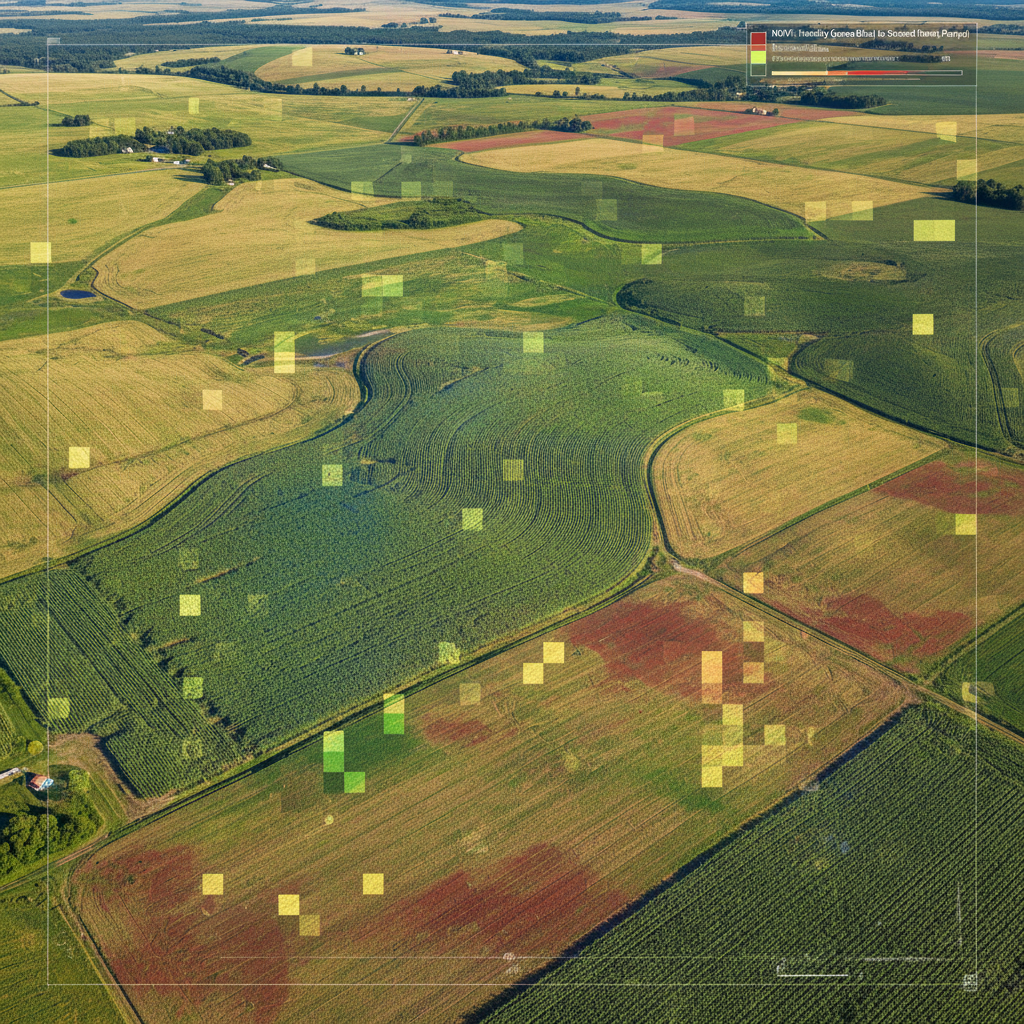
Aerial view of agricultural fields showing crop patterns with satellite NDVI overlay visualization
Fields monitored globally4.2M
Yield forecast accuracy94.7%
Lead time vs ground data+6hours
AGRICULTURE & COMMODITIES

Hedge futures against drought patterns before the market moves.

Agricultural conglomerates receive field-level NDVI, NDWI, and SAVI indices updated every fifteen minutes during growing season. A drought stress event in the São Francisco Valley appears in your risk model 6 hours before it surfaces in weather station data. Commodity traders at firms like Archer-Daniels-Midland use our crop stress index to position futures positions ahead of harvest yield revisions.
Automated anomaly detection with configurable alert thresholds
Direct API integration with existing risk management platforms
Custom spectral band combinations per use case
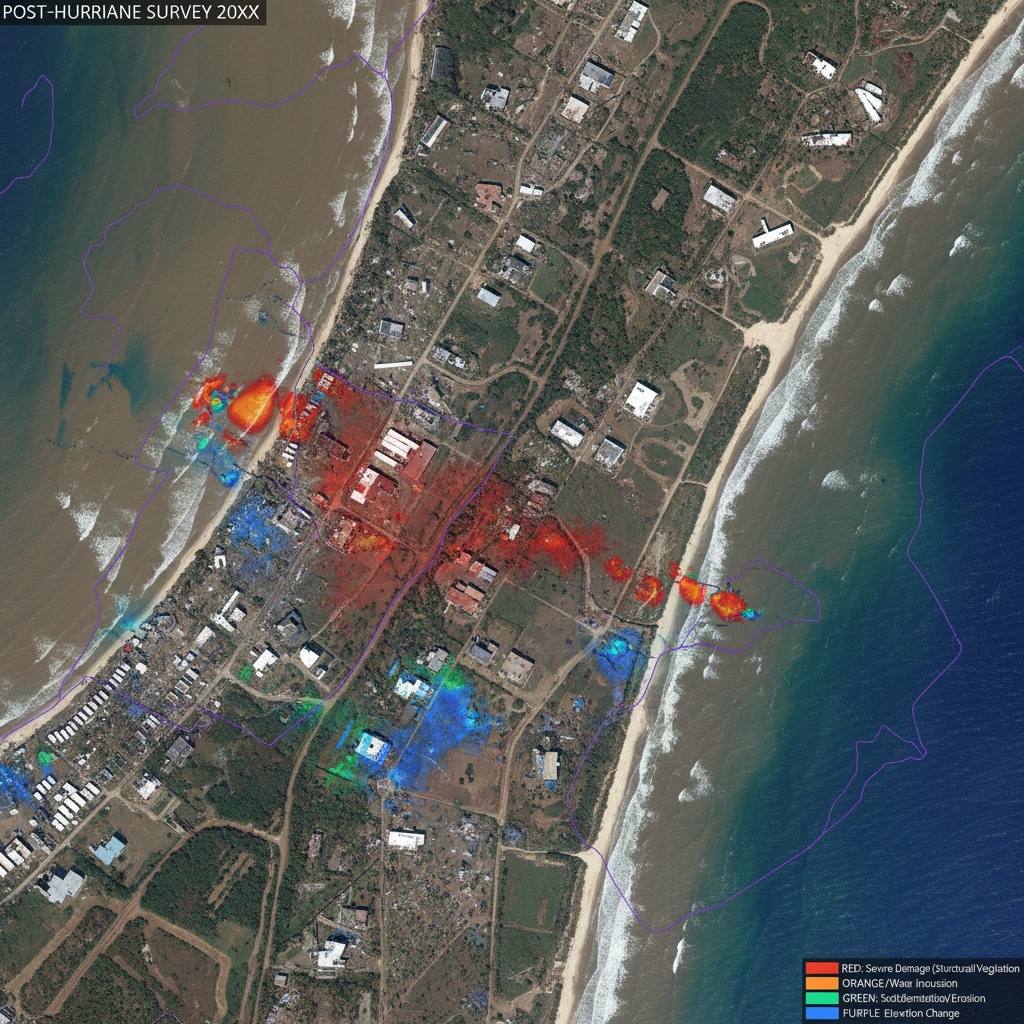
Satellite coastal imagery showing hurricane damage assessment with spectral analysis overlays
Post-event assessment48hrs
Damage classification accuracy96.3%
Properties assessed post-Ian1.1M
INSURANCE & RISK

Reprice coastal portfolios after every hurricane season.

Insurance underwriters at carriers like Zurich and AXA XL use Orbit's post-event damage assessment to update property exposure models within 48 hours of landfall — before adjusters reach the field. Our spectral change detection distinguishes structural damage from debris scatter, enabling automated claims triage and reinsurance treaty negotiations grounded in satellite-verified loss estimates.

Automated anomaly detection with configurable alert thresholds
Direct API integration with existing risk management platforms
Custom spectral band combinations per use case
TECHNICAL PROOF

Read the whitepaper.
Or read this page.

Every specification is documented, every claim is reproducible. The bands below are not marketing — they are the physics of what we can detect.

SPECTRAL BAND REGISTRY — 14 BANDS443nm — 2350nm
#λNAME
1
443nmCoastal Aerosol
2
490nmBlue
3
560nmGreen
4
665nmRed
5
705nmRed Edge 1
6
740nmRed Edge 2
7
783nmRed Edge 3
8
842nmNIR Broad
8A
865nmNIR Narrow
9
945nmWater Vapor
10
1375nmSWIR Cirrus
11
1610nmSWIR 1
12
2190nmSWIR 2
13
2350nmSWIR 3
CONSTELLATION & PIPELINE
7years
Calibrated archive depth
2019 — present, cross-sensor normalized
2.4PB
Total stored imagery
Compressed, indexed, query-ready
14ground stations
Downlink network
6 continents, <4min downlink latency
47satellites
Active constellation
Optical + SAR + hyperspectral
99.97%
API uptime SLA
12-month trailing average
<4min
Downlink-to-delivery
Median end-to-end pipeline
API QUICKSTARTREST · v4.2
# Request latest 10m imagery for AOI
curl https://api.orbit.ai/v4/imagery \
-H "Authorization: Bearer $TOKEN" \
-d '{"bbox": [-87.65,41.83,-87.61,41.87],
"bands": [4,5,8,"8A",12],
"resolution": 10,
"max_age_minutes": 15}'
# Response: 847ms median ↓
HTTP/2 200 — imagery_id: orb_20260227_2338_07
SANDBOX ENVIRONMENT — LIVE DATA

The demo is not a toy.
It's the actual data.

The sandbox runs against our live constellation feed. You'll manipulate real spectral imagery, real alert streams, real API responses — not a staged mockup. If the demo doesn't convince you, the product won't either.

🛡
ITAR Compliant
Level III clearance
No Setup Required
API key in 60 seconds
📡
Live Feed
Real constellation data